Performance Monitor Update - Release 2025.4
4/3/2026

Artur Boguszewski

The latest version of DBPLUS Performance Monitor extends performance analysis capabilities and improves the reliability of monitoring data in environments Oracle Database, SQL Server, and PostgreSQL. The update introduces, among other things, better insight into the actual execution of queries, control of changes in plans, elimination of erroneous aggregation of statistics, and new mechanisms for monitoring services and replication.
Added Adaptive Execution Plans support to analyze the actual execution flow of queries and dynamic Oracle optimizer decisions. Information about the adaptability of the plan is available in the Explain Plan tab.
Adaptive plans allow the Oracle engine to change execution strategy as the query runs (e.g., select HASH JOIN instead of NESTED LOOPS) based on actual data.
Benefits:
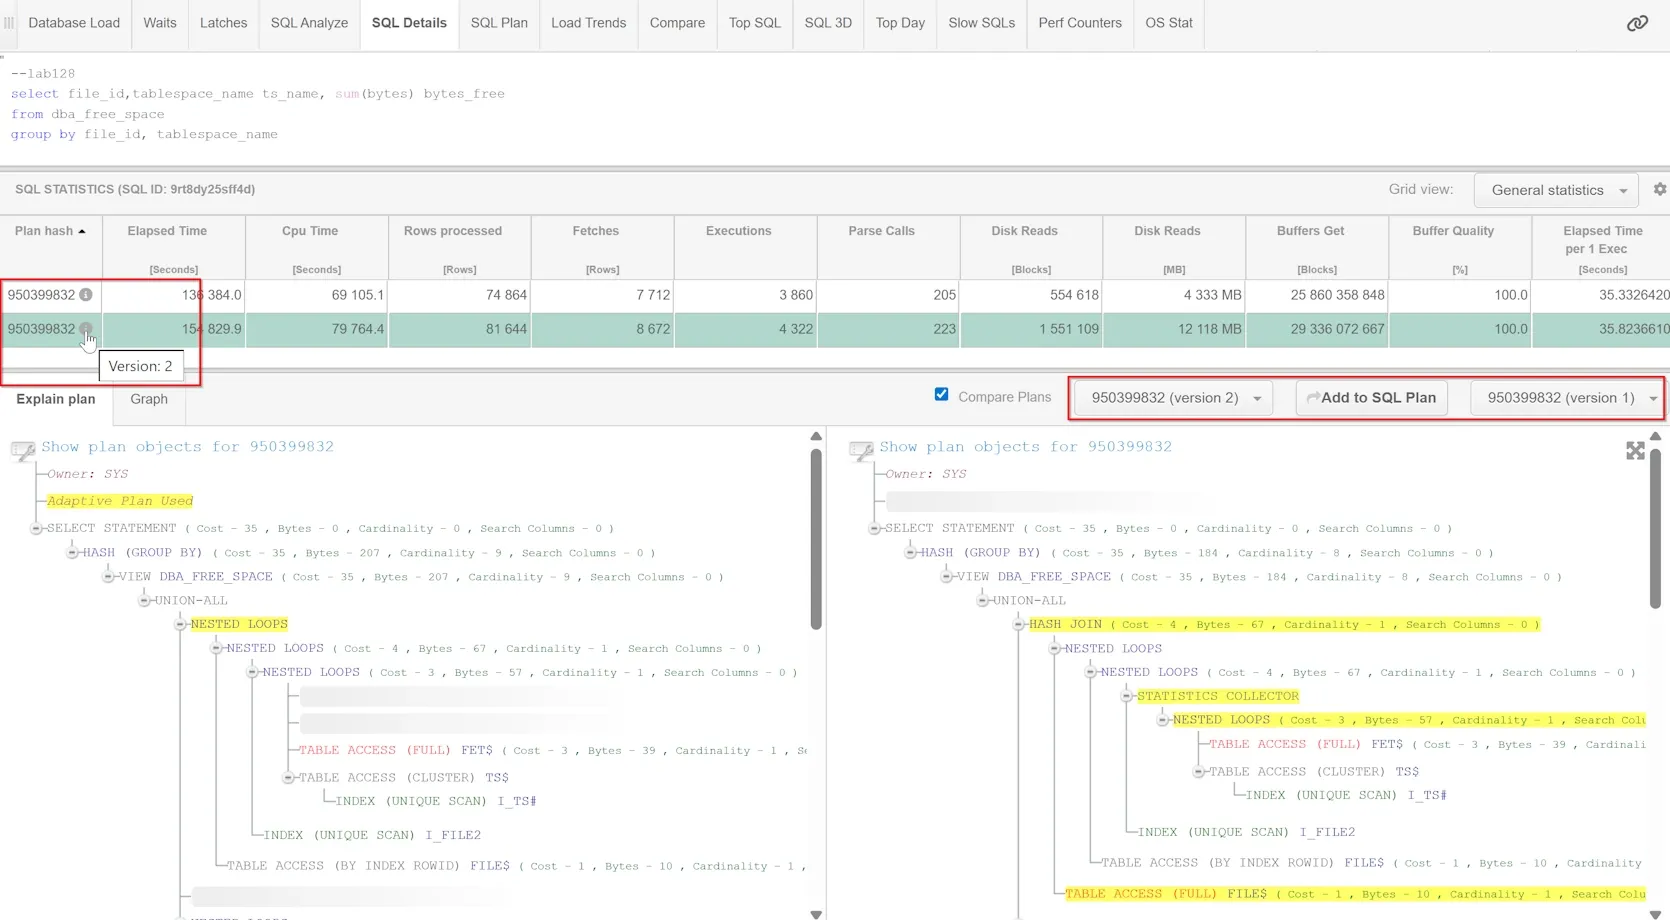
Versioning of plans is introduced when different execution plans appear for the same PlanHash Value. The app assigns versions to plans and allows you to compare them. Benefits: identification of optimizer changes, performance regression analysis, query tuning support.
Detailed information about the changes for Oracle is available at links.
Improved query monitoring eliminating the problem of aggregating different queries with the same query_hash.
The system creates an additional technical identifier for the unique query text, so that:
On the SQL Details screen, there is a version switch and an option Comparar versão to compare the differences.
Benefits: more accurate statistics, faster regression detection, identification of problematic variants, improvement of the effectiveness of PlanGuide.
Added monitoring service status and data collection threads feature. Access: Server monitor → Application architecture. The information presented includes, but is not limited to, recent snapshots, thread activity, and monitoring delays.
Status can be automatically retrieved via REST API using GET method and endpoint: /health_check. The API returns information about the status of the services, the instance, and the use of server resources.
Benefits: control automation, faster problem detection, integration with monitoring systems.
Detailed information about the changes for SQL Server is available at links.
Added real-time logical replication monitoring available on the Dashboard and in the Replication → Replication Online menu.
The application automatically detects the participation of the instance in the replication and its role (Publisher or Subscriber), presenting the configuration and statistics for replication slots. The following are monitored, among others:
Publisher:
Subscriber:
It is possible to visualize trends on the chart and configure alarm thresholds (Dashboard thresholds). Status colors indicate warnings or errors.
Benefits: Ongoing control of data synchronization, rapid detection of replication delays, and analysis of trends and stability of connections.
Added the ability to delete aggregated daily data stored in the repository. Settings are available in: Configuration → Settings → History settings for data grouped by day. You can specify the retention period for different areas (queries, sessions, waits, IO, replication, space, alerts, etc.).
⚠ Deleted data cannot be restored. Process logs are available in: Servers monitor → Logs → Deletion procedure runtime
Benefits: control of the size of the repository and optimization of space utilization. The update significantly increases the transparency and accuracy of monitoring.
Detailed information about the changes for PostgreSQL is available at links.
The changes support DBA and development teams to diagnose problems faster and optimize system performance.


